DevOpSmartBoard
Custom dashboard at the Azure DevOps organization Level and also at the Project Level
It is a well-known fact that DevOpSmartBoard generates key metrics at the Azure DevOps organization level and also at the team project level. This give users the freedom to access various types of reports based on different needs either role based or SDLC stage. All the reports are available in a single platform and are easy to access and certainly this is a great advantage for the end users. The report also does have the option to export certain files to external files that are exclusively meant for emailing. This makes it available for both online and offline use. Undoubtedly, this is such a striking feature that it makes the DevOpSmartBoard more approachable and attractive for the users. In the recent times, DevOpSmartBoard has gained immense popularity because of its flexibility and multiple advantages. Azure DevOps is here to stay for a long time to come.
Let us see some key uses and important features of DevOpSmartBoard:
Helps you to track organizational data:
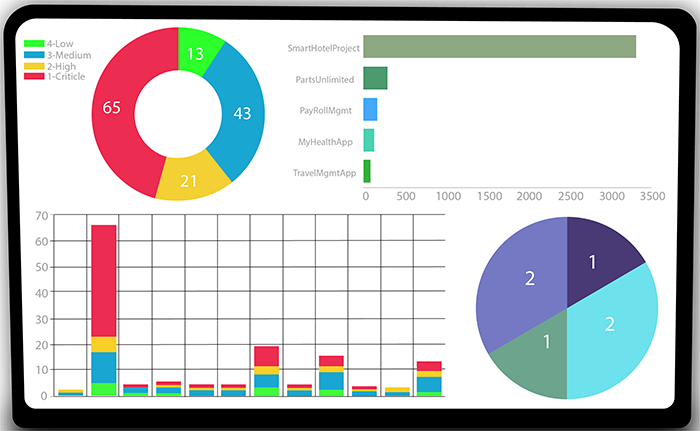
This is another very striking advantage of DevOpSmartBoard as it helps you to track organizational data. The Organization View report usually displays the overall metrics of the Azure DevOps in the organization in terms of number of projects, users, total work items, repos, active pull requests and build and releases triggered in the last 7 days. This is truly amazing. These reports collect aggregate data from work items, GIT version control, builds and releases across all projects within the organization. You can even see the top 5 projects work items numerically alongside the build and release execution count. There is even a bug severity view that displays bugs with different severity level across all projects in the organization. As an user this greatly helps to have an overall view of the organizational data and to formulate the business plans accordingly.

Helps you to Track your Team Project Data:
The project dash board is responsible for providing visual charts which includes work item types, bug severity, build and release executions. The report lists, the most recent builds/releases that were evidently captured during the run and subject to the filters that are set in the report. This enormously enhances the visibility of the user and enables him to formulate important business decisions in a more practical and pragmatic way.
Query work items:
You generally get a flat list of work items view at selected organization and project level. The reports come with filter that will help you to view only specific contents in the report. This makes the whole approach more systematic and practical. The filters normally include projects, Iteration/ sprints, work item types and states. This is a special benefit and the user has the option to view only those items that he would want to. The user can save a lot of precious time and effort and this tool is a lot simpler and easier to use.

.png)
Subscribers (Audit License usage):
In the subscriber report you may find a detailed list of all users in the said organization. The total number of users is showcased based on their access levels – Basic Basic+TestPlans, Stakeholder Visual Studio MSDN Subscription Visual Studio Subscriber This makes the whole thing much easier and simpler for the customer, who in many of the cases, would want to have a specific view of a certain thing.
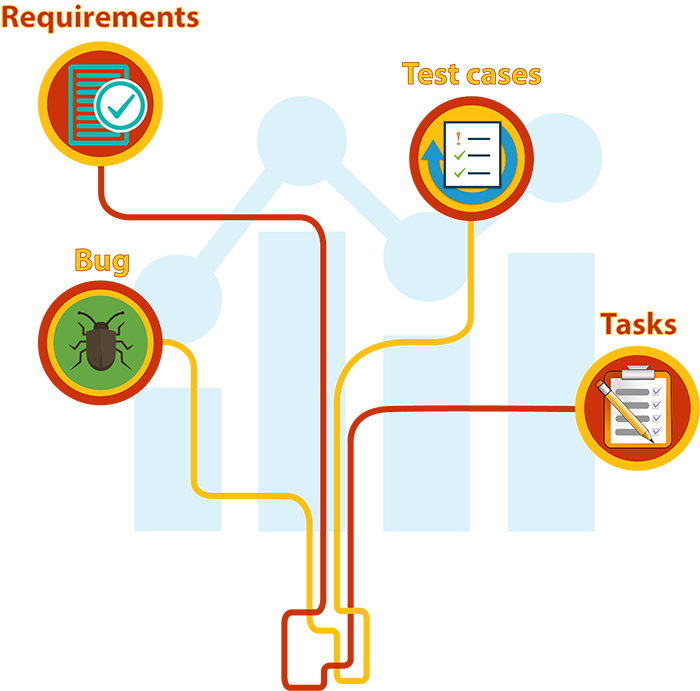
End-to -End Traceability:
The traceability report provides for an end-to-end relationship between requirements, tasks, test cases and bugs along with commits.

Team Capacity Across Teams:
The team capacity report provides a view of how the team members are managed across different teams and projects. This enables the senior management to have a proper control over the projects in progress and also over individual team members.
Tracking Project Health:
The Project Health report actually provides a brief about the progress made in a project in terms of build & release failures, critical bugs & overdue items based on date range or iterations. Using the trend chart the user can visualize the status or health of the project and take the necessary actions that are required. This actually ensures an excellent control of the management over the on-going projects and enables a smooth execution.

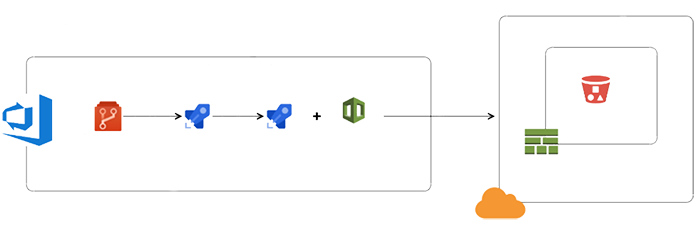
Tracks status of Azure Pipelines Execution:
The Azure report actually provides consolidated views of pipelines across the project especially at the DevOps organization level. The user has the flexibility or the option to filter the data based on projects, definition etc. and export to excel for further processing. Tracking status is a very important part and parcel for smooth execution and implementation of any project and this is so very crucial feature.
Canarys is a certified Microsoft DevOps partner and a verified GitHub Partner with a proven expertise for more than 30 years. We are a comprehensive solution provider, specializing in DevOps and Automation. Till date we have successfully delivered numerous projects to our clients all over the globe and won accolades. Our ever-growing list of clients show our commitment and dedication for the work. With an experienced and talented workforce, we have the confidence to beat any kind of challenge that comes our way. We take great pride in our workforce, which is of course diverse in nature and works with a positive attitude. When it’s Canarys, you can be sure of quality services and solutions.